> ## Documentation Index
> Fetch the complete documentation index at: https://docs.opigno.com/llms.txt
> Use this file to discover all available pages before exploring further.
# Statistics
The **statistics** tool is a dashboard where you can track the global KPIs across the learner areas (hierarchies) you have access to and generate custom reports on the learner progress.
**NOTE:** Statistics account for only authenticated learner profiles. Administrators, anonymous learners, and blocked users are excluded.
**NOTE:** Statistics are available only to **administrators** and **statistics managers**.
## The dashboard
You can access the statistics dashboard from the left-hand menu under **Tools**.
### Global statistics
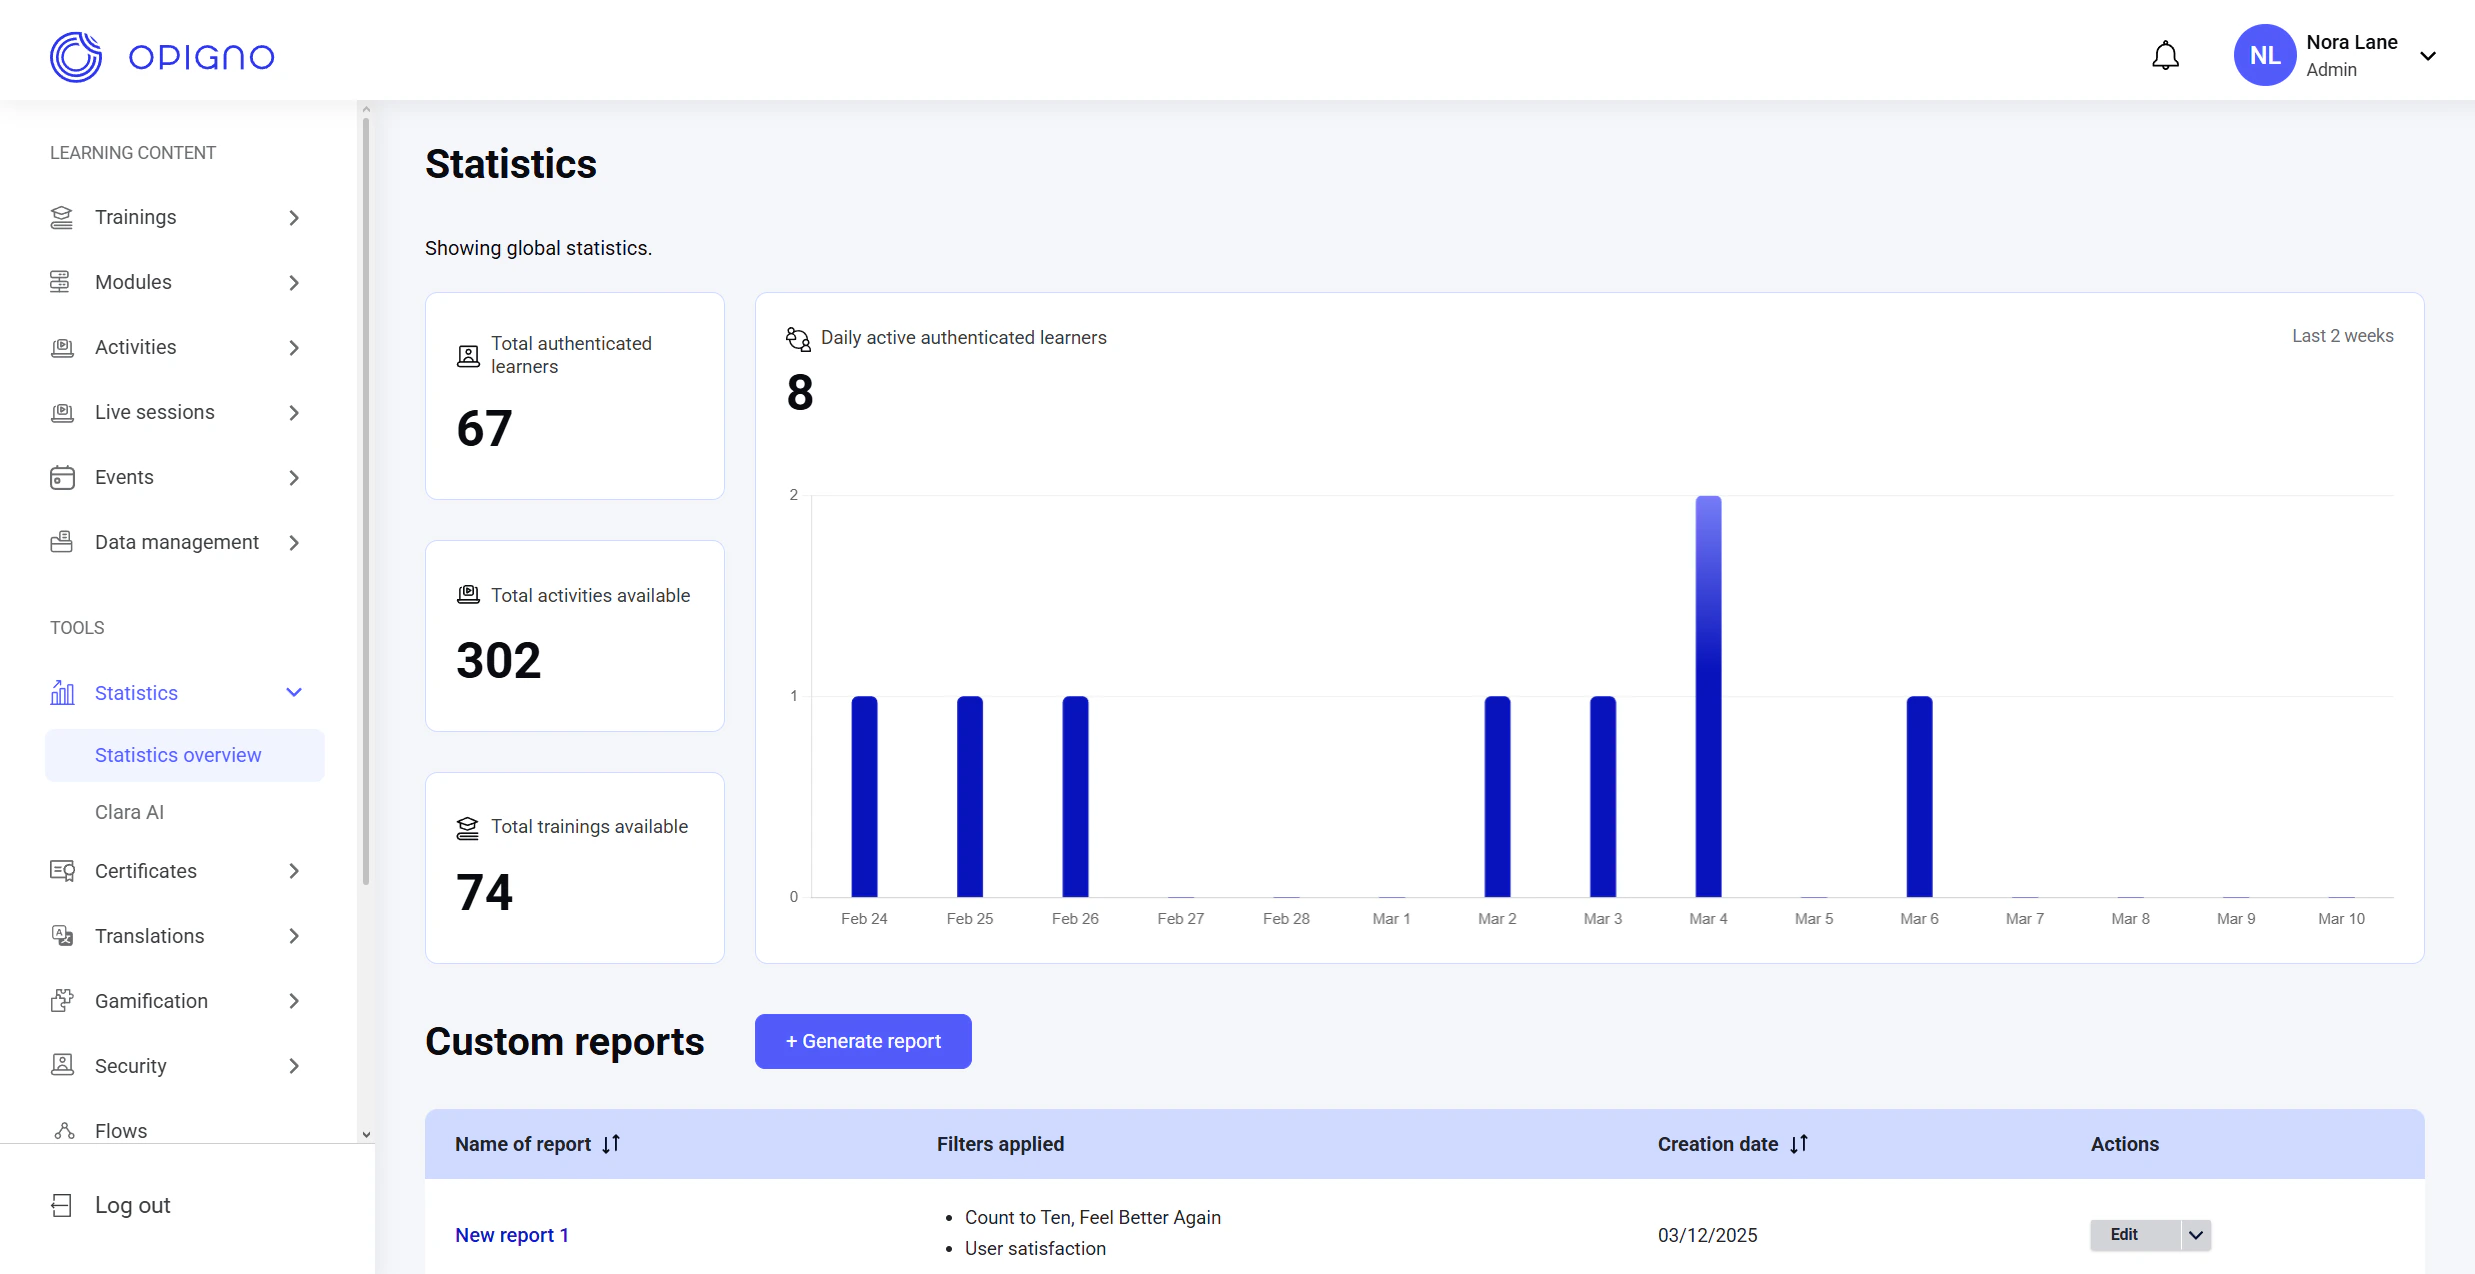 The top section of the dashboard displays four global indicators:
* **Total number of users**\
Counts all authenticated learner accounts within the viewing user's hierarchy and any sub-hierarchies.\
If the viewing user has no hierarchy assigned, all authenticated learners across all hierarchies are counted.
* **Total number of published activities**\
Counts all published activities across the platform, regardless of the viewing user's hierarchy.
* **Total number of published trainings**\
Counts all trainings published under the viewing user's hierarchy and all its sub-hierarchies, plus any trainings not assigned to a specific hierarchy.\
If the viewing user has no assigned hierarchy, all published trainings are counted.
* **Total number of active users per day**\
Counts all learners within the viewing user's hierarchy and its sub-hierarchies who submitted at least one activity answer per day.\
The chart shows data for the last 14 days.
### Custom reports table
Below the top chart, you'll find a table listing all custom reports created by the viewing user.
**NOTE:** Each report can be generated for only one training.
Users can only see their own reports.
The top section of the dashboard displays four global indicators:
* **Total number of users**\
Counts all authenticated learner accounts within the viewing user's hierarchy and any sub-hierarchies.\
If the viewing user has no hierarchy assigned, all authenticated learners across all hierarchies are counted.
* **Total number of published activities**\
Counts all published activities across the platform, regardless of the viewing user's hierarchy.
* **Total number of published trainings**\
Counts all trainings published under the viewing user's hierarchy and all its sub-hierarchies, plus any trainings not assigned to a specific hierarchy.\
If the viewing user has no assigned hierarchy, all published trainings are counted.
* **Total number of active users per day**\
Counts all learners within the viewing user's hierarchy and its sub-hierarchies who submitted at least one activity answer per day.\
The chart shows data for the last 14 days.
### Custom reports table
Below the top chart, you'll find a table listing all custom reports created by the viewing user.
**NOTE:** Each report can be generated for only one training.
Users can only see their own reports.
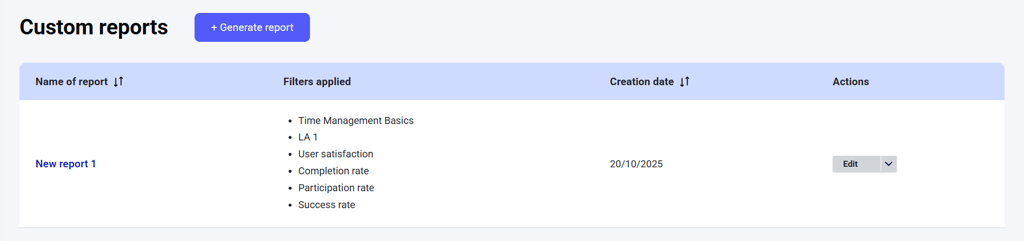
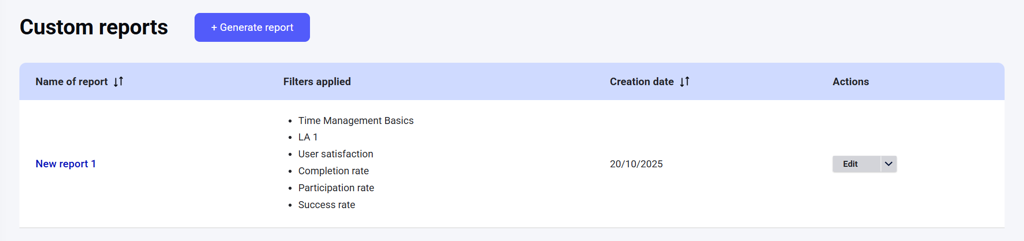 The table displays the following attributes:
* **Name of report**
* **Filters applied**: The configuration of the report — selected training, selected hierarchy or sub-hierarchy, and chosen KPIs
* **Creation date**
* **Actions**: Edit or delete
## Generating a report
To create a new report, click **Generate report** below the top chart.
The table displays the following attributes:
* **Name of report**
* **Filters applied**: The configuration of the report — selected training, selected hierarchy or sub-hierarchy, and chosen KPIs
* **Creation date**
* **Actions**: Edit or delete
## Generating a report
To create a new report, click **Generate report** below the top chart.
 A report configuration panel will open:
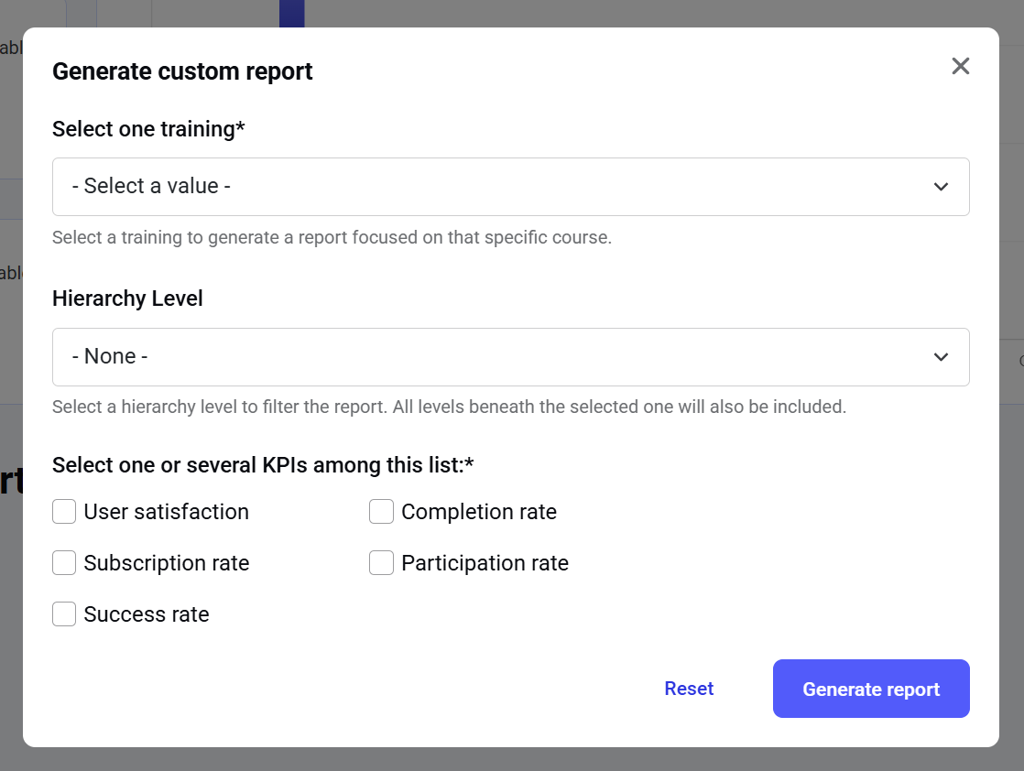 Here, you can define:
* **Training**: the training you want statistics for (a required field). Each report can include **only one training**.
* **Hierarchy**: a hierarchy or sub-hierarchy to narrow the scope. Each report can include only one hierarchy level or one sub-level. If you select a hierarchy with sub-hierarchies, all sub-levels will automatically be included in the report scope.\
If you choose not to select any hierarchy, the report will include **all** hierarchies.
* **KPIs**: one or more KPIs to include in the report (a required field). There are five KPIs available:
* **Learner satisfaction**: Average rating (out of 5) of the selected training given by learners in the selected hierarchy, or all learners if no hierarchy is selected. If learners restart a training and submit multiple evaluations, **all** of their evaluations are included.
* **Completion rate**: Percentage of learners who completed the training (100% progress) out of all learners in the selected hierarchy or all learners if no hierarchy is selected.
* **Subscription rate**: Percentage of learners subscribed to the selected training out of all learners in the selected hierarchy, or all learners if no hierarchy is selected.
* **Participation rate**: Percentage of learners who started the training (clicked **Start**), even if they are not subscribed, within the selected hierarchy, or all learners if no hierarchy is selected.
* **Success rate**: Percentage of learners who passed the training within the selected hierarchy or all learners if no hierarchy is selected.
**NOTE:** For all KPIs **except User satisfaction**, if a learner has multiple attempts (for example, because a training expired or was restarted due to a new version), **only the latest attempt** is counted.
Here, you can define:
* **Training**: the training you want statistics for (a required field). Each report can include **only one training**.
* **Hierarchy**: a hierarchy or sub-hierarchy to narrow the scope. Each report can include only one hierarchy level or one sub-level. If you select a hierarchy with sub-hierarchies, all sub-levels will automatically be included in the report scope.\
If you choose not to select any hierarchy, the report will include **all** hierarchies.
* **KPIs**: one or more KPIs to include in the report (a required field). There are five KPIs available:
* **Learner satisfaction**: Average rating (out of 5) of the selected training given by learners in the selected hierarchy, or all learners if no hierarchy is selected. If learners restart a training and submit multiple evaluations, **all** of their evaluations are included.
* **Completion rate**: Percentage of learners who completed the training (100% progress) out of all learners in the selected hierarchy or all learners if no hierarchy is selected.
* **Subscription rate**: Percentage of learners subscribed to the selected training out of all learners in the selected hierarchy, or all learners if no hierarchy is selected.
* **Participation rate**: Percentage of learners who started the training (clicked **Start**), even if they are not subscribed, within the selected hierarchy, or all learners if no hierarchy is selected.
* **Success rate**: Percentage of learners who passed the training within the selected hierarchy or all learners if no hierarchy is selected.
**NOTE:** For all KPIs **except User satisfaction**, if a learner has multiple attempts (for example, because a training expired or was restarted due to a new version), **only the latest attempt** is counted.
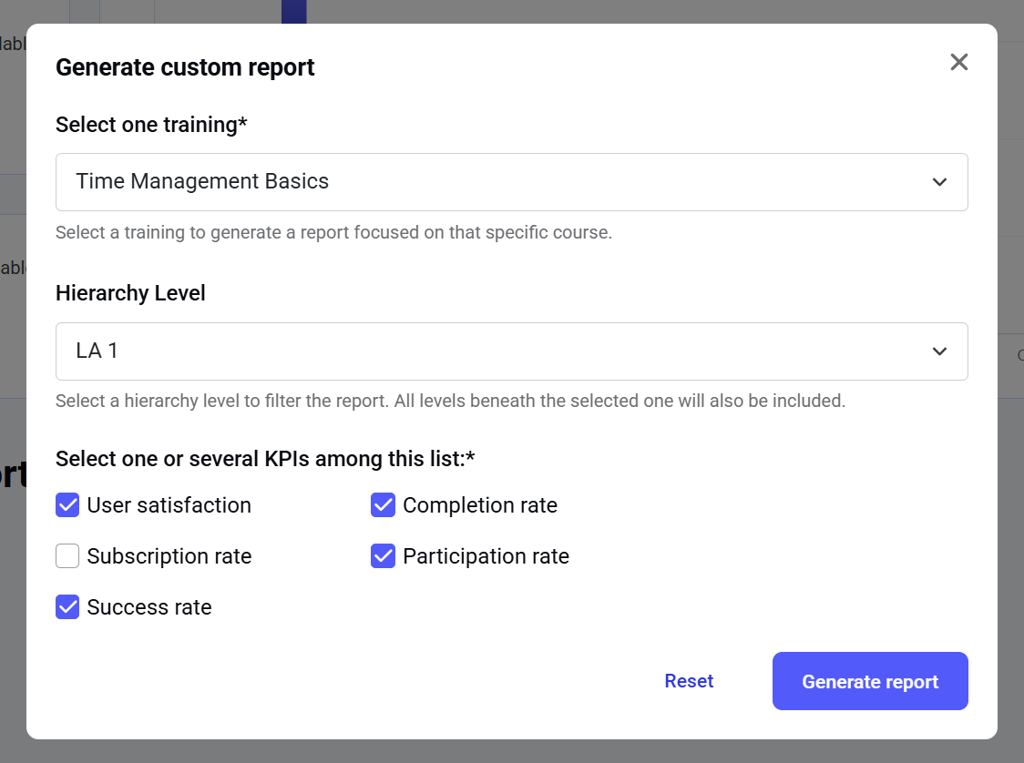 To discard the configuration, click **Reset**.
To finalize, click **Generate report**.
## Viewing a report
Once generated, the report opens automatically. Click **Save** to keep the report; it will then appear in the Custom reports table.
### Training statistics
You can open any saved report later by clicking its name in the Custom reports table.
To discard the configuration, click **Reset**.
To finalize, click **Generate report**.
## Viewing a report
Once generated, the report opens automatically. Click **Save** to keep the report; it will then appear in the Custom reports table.
### Training statistics
You can open any saved report later by clicking its name in the Custom reports table.
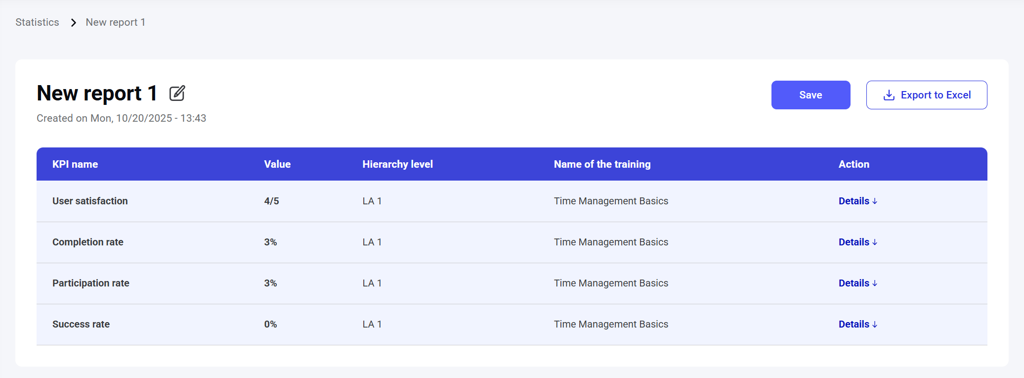 Each report displays a table with:
* **KPI name**
* **Value**
* **Hierarchy level**
* **Training name**
* **Actions**: a **Details** link for in-depth data. Clicking it reveals an additional table with more information per the KPI:
* **Learner satisfaction:** List of learner ratings and feedback comments for the selected training within the selected hierarchy.
* **Completion rate:** List of learners and their training scores.
* **Success rate:** List of learners and their training status (not started / in progress / passed/failed/expired).
* **Subscription rate:** List of learners and their training progress.
* **Participation rate:** List of learners and their training progress.
Each report displays a table with:
* **KPI name**
* **Value**
* **Hierarchy level**
* **Training name**
* **Actions**: a **Details** link for in-depth data. Clicking it reveals an additional table with more information per the KPI:
* **Learner satisfaction:** List of learner ratings and feedback comments for the selected training within the selected hierarchy.
* **Completion rate:** List of learners and their training scores.
* **Success rate:** List of learners and their training status (not started / in progress / passed/failed/expired).
* **Subscription rate:** List of learners and their training progress.
* **Participation rate:** List of learners and their training progress.
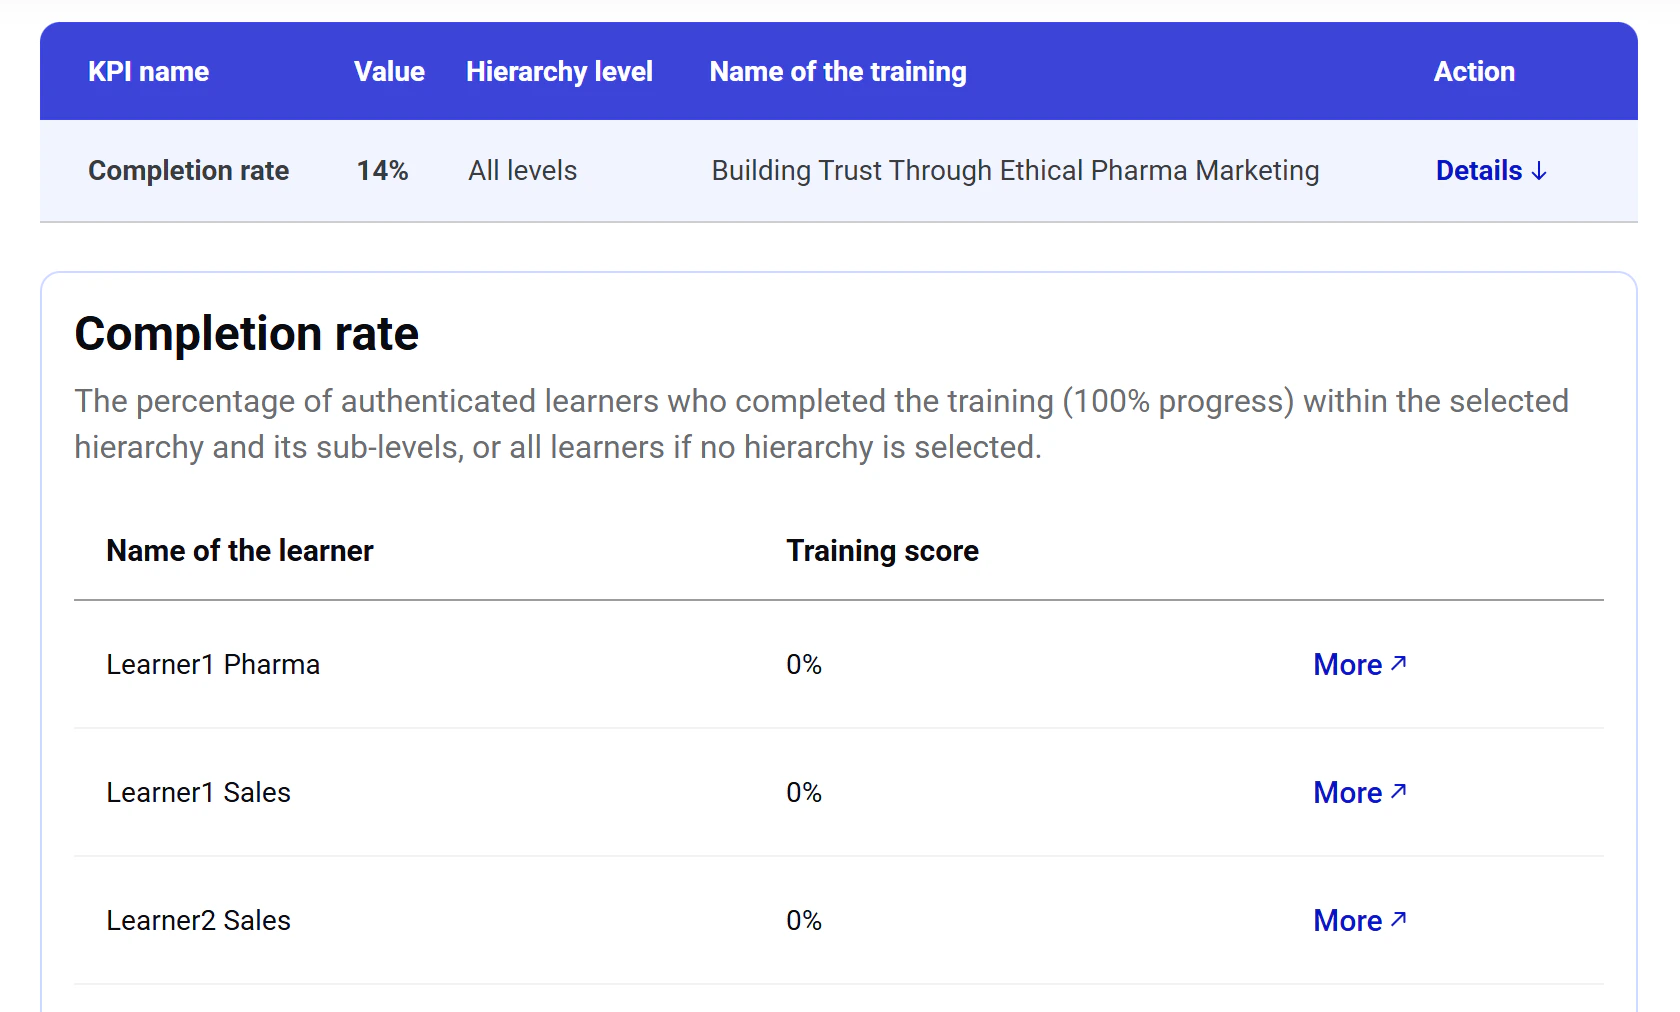 Click **More** next to the learner's name to open the per-user statistics in a new tab.
### Per-user statistics
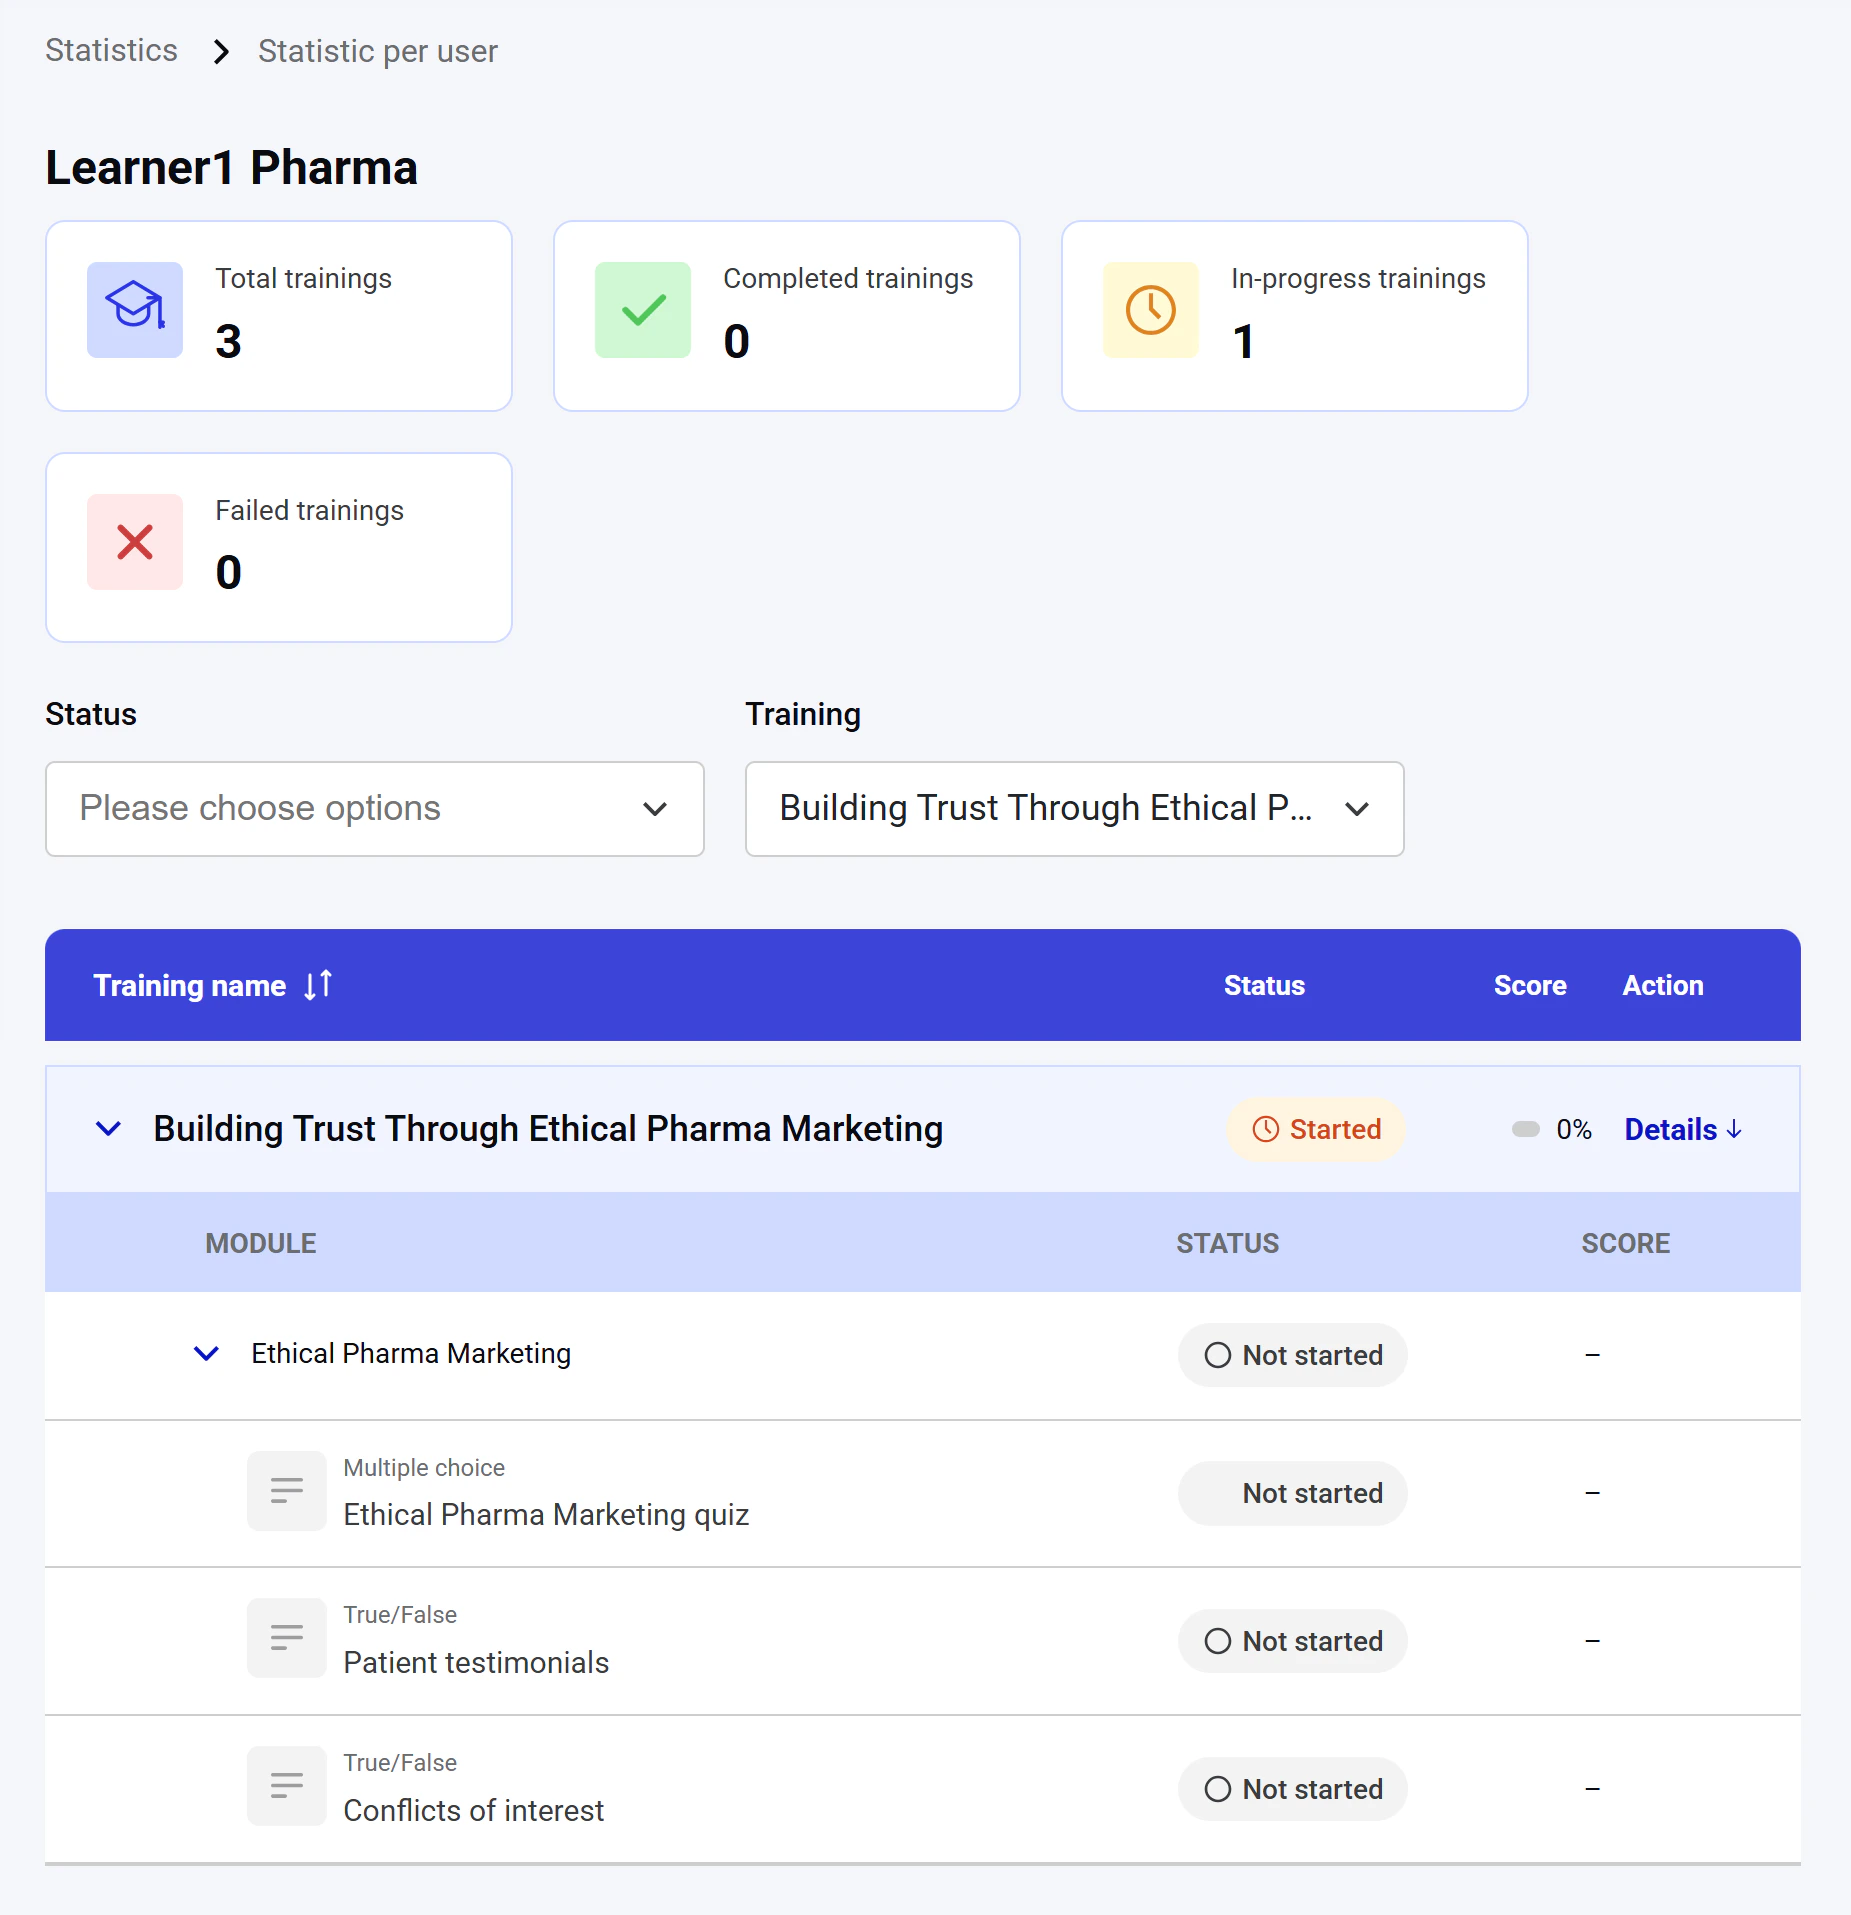
The interface lists all trainings the selected learner is registered for and their statuses, with the breakdown by module and activity level.
Click **More** next to the learner's name to open the per-user statistics in a new tab.
### Per-user statistics
The interface lists all trainings the selected learner is registered for and their statuses, with the breakdown by module and activity level.
 ### **Exporting a report**
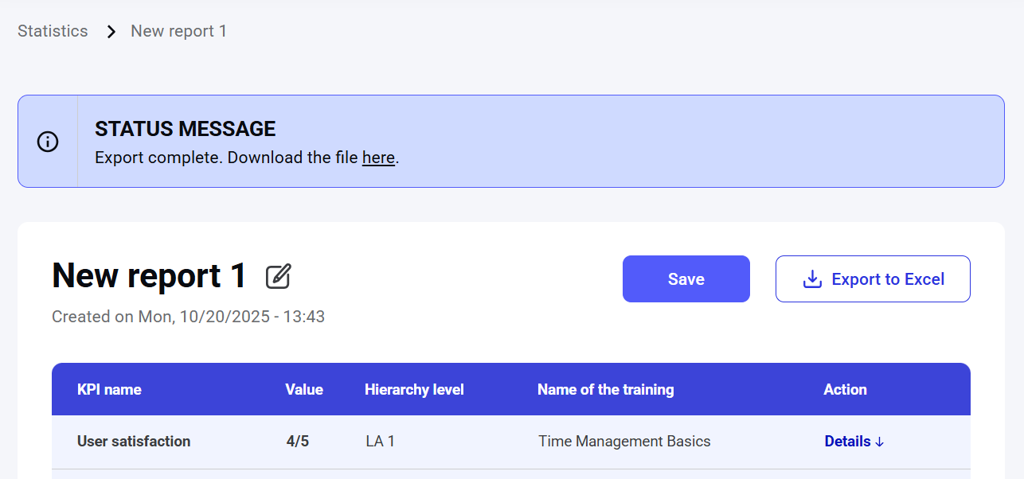
Click **Export to Excel** to export the report as an .xls file. The file contains one sheet per KPI with the corresponding details.
After generation, a status message with a download link appears at the top of the page.
### **Exporting a report**
Click **Export to Excel** to export the report as an .xls file. The file contains one sheet per KPI with the corresponding details.
After generation, a status message with a download link appears at the top of the page.
 ## Editing a report
### Editing the report name
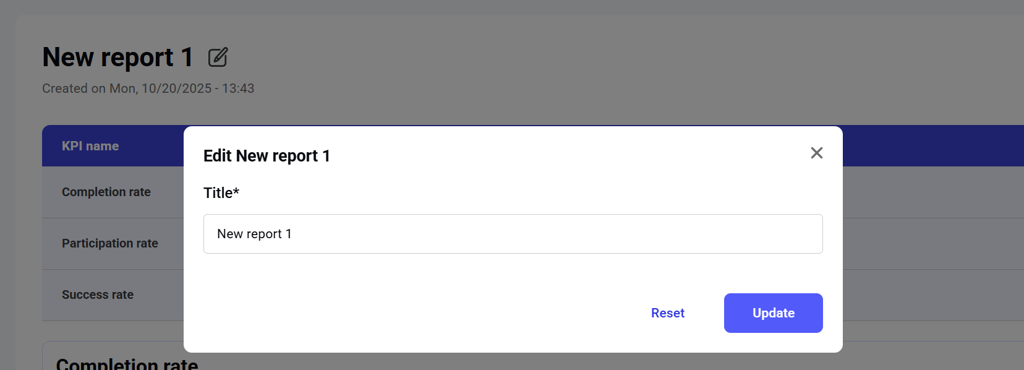
In the report view, click the **Edit** icon next to the report name.
## Editing a report
### Editing the report name
In the report view, click the **Edit** icon next to the report name.
 ### Editing report scope
To modify the training, hierarchy, or KPIs:
1. Go to the **Custom reports** table on the Statistics dashboard.
2. Open the **Actions** menu for the report.
3. Click **Edit**.
### Editing report scope
To modify the training, hierarchy, or KPIs:
1. Go to the **Custom reports** table on the Statistics dashboard.
2. Open the **Actions** menu for the report.
3. Click **Edit**.
 The editing panel opens with the existing configuration. You can change any of the parameters:
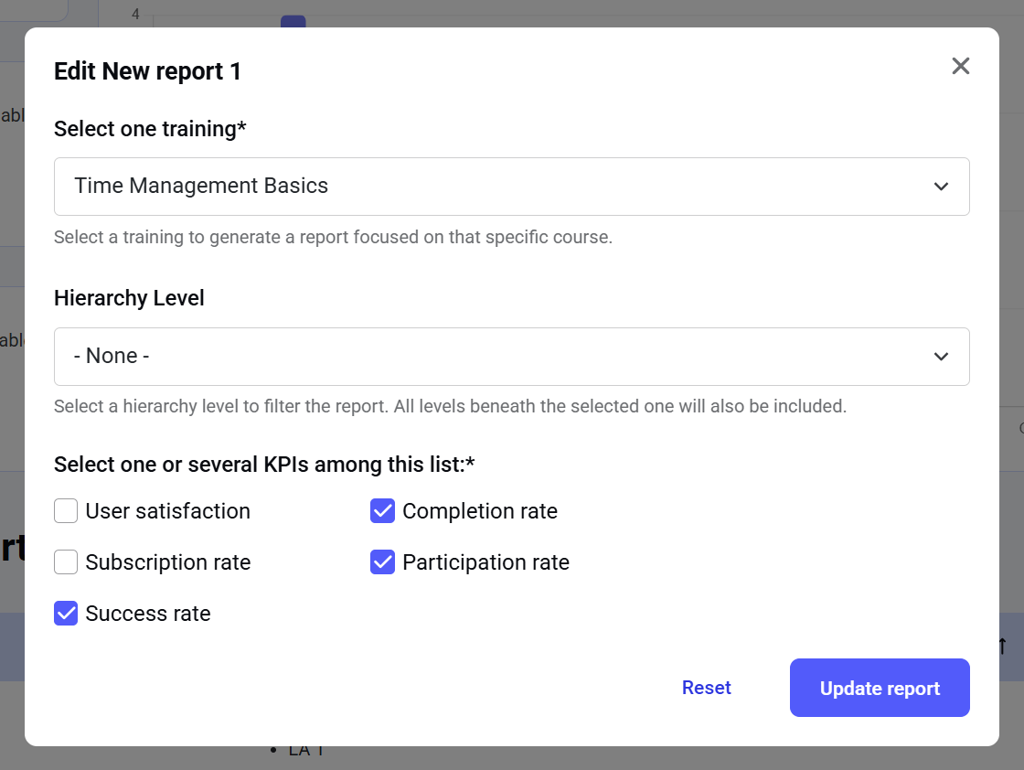 Click **Reset** to discard changes or **Update report** to save.
## Deleting a report
To delete a report:
1. Go to the **Custom reports** table.
2. Open the **Actions** menu for the report.
3. Click **Delete**.
Click **Reset** to discard changes or **Update report** to save.
## Deleting a report
To delete a report:
1. Go to the **Custom reports** table.
2. Open the **Actions** menu for the report.
3. Click **Delete**.
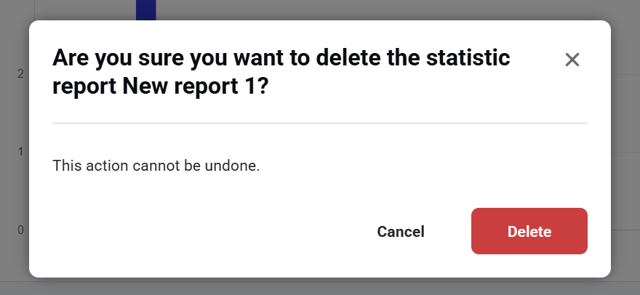
 A confirmation pop-up appears. Select **Delete** to confirm or **Cancel** to stop the action.
Deleted reports cannot be restored.
A confirmation pop-up appears. Select **Delete** to confirm or **Cancel** to stop the action.
Deleted reports cannot be restored.